1. Seqinspector
1.1. What is seqinspector?
The seqinspector tool was designed to provide a computational service that utilizes up-to-date ChIP-seq data. Seqinspector allows to study the functional enrichments of user-defined DNA regions. This includes putative regulators of co-expressed genes.
1.3. Tutorials
1.4. User interface
User interface consist of four parts. On the top of the page there is a navigation bar with some internal links to help or other tools. On the left there is an input part in which you can select genome assembly, input your query set and submit it. Right from it there is a list of submitted query sets. One of them is selected as background for statistics. On the bottom of the page is table with results sorted by p-value.
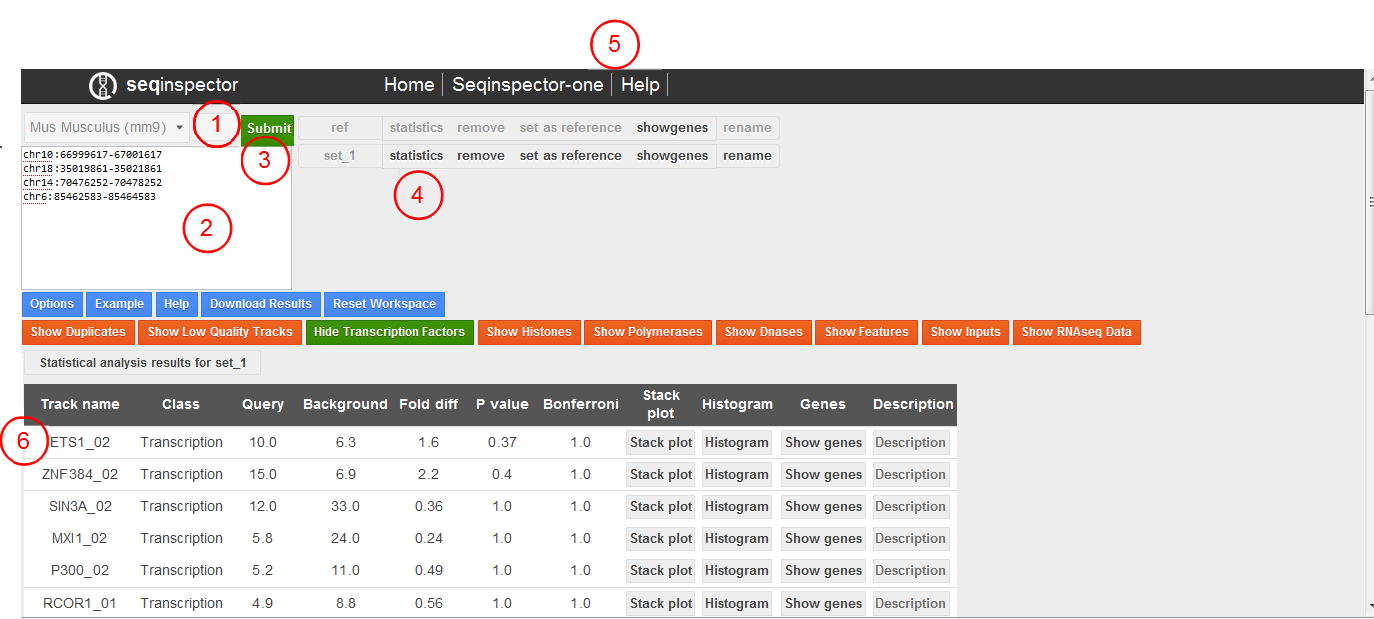
Seqinspector user interface. (1) genome assembly selector, (2) text field for query input, (3) submit button, (4) list of query sets, (5) navigation bar with internal links, (6) results table
1.5. How to use it?
1.5.1. Step 1: Prepare your list
You should prepare your input list in one of the following formats.
1.5.1.1. bed
chr16        30254029        30255503
chr4 49268883        49272093
chr1 145968637       145969897
...
1.5.1.2. genomic coordinates
chr10:66999617-67001617
chr18:35019861-35021861
chr14:70476252-70478252
...
1.5.1.3. gene symbols
Egr1
Egr2
Fos
...
1.5.1.4. ensembl transcript ids
ENSMUST00000165033
ENSMUST00000145936
ENSMUST00000140525
...
1.5.1.5. refseq mRNA ids (no subversions)
NM_007913
NM_010118
NM_010234
...
1.5.2. Step 2: Choose genome assembly
You are allowed to choose between Homo sapiens (hg19) and Mus musculus (mm9, mm10)
1.5.3. Step 3: Insert your query list
The optimal list length is about 50 items. Seqinspector was tested with up to 1000 items lists.
1.5.4. Step 4: Submit and wait
Press the submit button. Seqinspector will automatically convert gene symbols or transcripts into genomic intervals 2000 bp long around transcription start sites. If a gene has more than one start site, all will be used. If some genomic intervals are overlapping they are merged. Seqinspector will then compute coverage from all available tracks for your query set of genomic intervals. Calculation progress will be shown on the screen.
1.5.5. Step 5: Inspect list of query sets
After pressing the submit button your query will appear on the list under unique name (“Set_1” if it is your first submission). Additionally there is allready preloaded reference set (1000 random promoters). Statistics is always computed in comparison to reference. Therefore, one of your uploaded queries might be set as a reference by pressing “set as reference” button. You can remove or rename any of your queries.
1.5.6. Step 6: Calculate statistics
After pressing the “statistics” button table with results will be presented on the bottom of the screen. The tracks are sorted by p-value of significance. The columns are:
- Track name - it is internal id of a track, that contains short name of a transcription factor
- Query - average coverage of query set
- Background - avergae coverage of reference set
- Fold diff - fold difference between query and reference
- P value - significance of difference between query and reference datasets (calculated by t-test)
- Bonferroni - Bonferroni corrected p-value
- Stack plot - heat stacked plots presenting distribution of coverages in all query sets with respective p-values
- Histogram - visualisation of average coverage (2000 bp around center of genomic interval) for all query sets
- Genes - genomic intervals in query sets, symbols for nearest genes and coverage for these intervals
- Description - description of a track
1.5.7. Step 7: Inspect your results
You can visualize your results by pressing “stack plot” or “histogram” buttons. You can also inspect which genes have the highest coverage of a particular track by pressing “show genes” button. From “show genes” dialog you can navigate to seqinspector-one tool to inspect individual gene.
1.5.8. Step 8: Change options
Change database. In seqinspector there are two databases: (1) Mus musculus and (2) Homo sapiens. You can inspect Human tracks with your murine genomic coordinates. Mouse coordinates will be translated into Human coordinates using liftover tool. Extend query range. If 1000 bp upstream and downstream from tss is too small for you, it is possible to expande query range by using this parameter. It is only possible for queries using gene symbols and transcript ids.