1. Seqinspector SRF tutorial
1.1. Contents
1.2. Background
Rodriguez-Parkitna et al. (2010) analyzed the consequences of SRF loss on the regulation of activity-dependent transcription in the striatum of Srf D1Cre animals after treatment with cocaine, a powerful activator of dopamine signaling. Using microarray profiling, they found that loss of SRF caused a specific and complete lack of induction of Egr1, Egr2, and Egr4 transcripts.
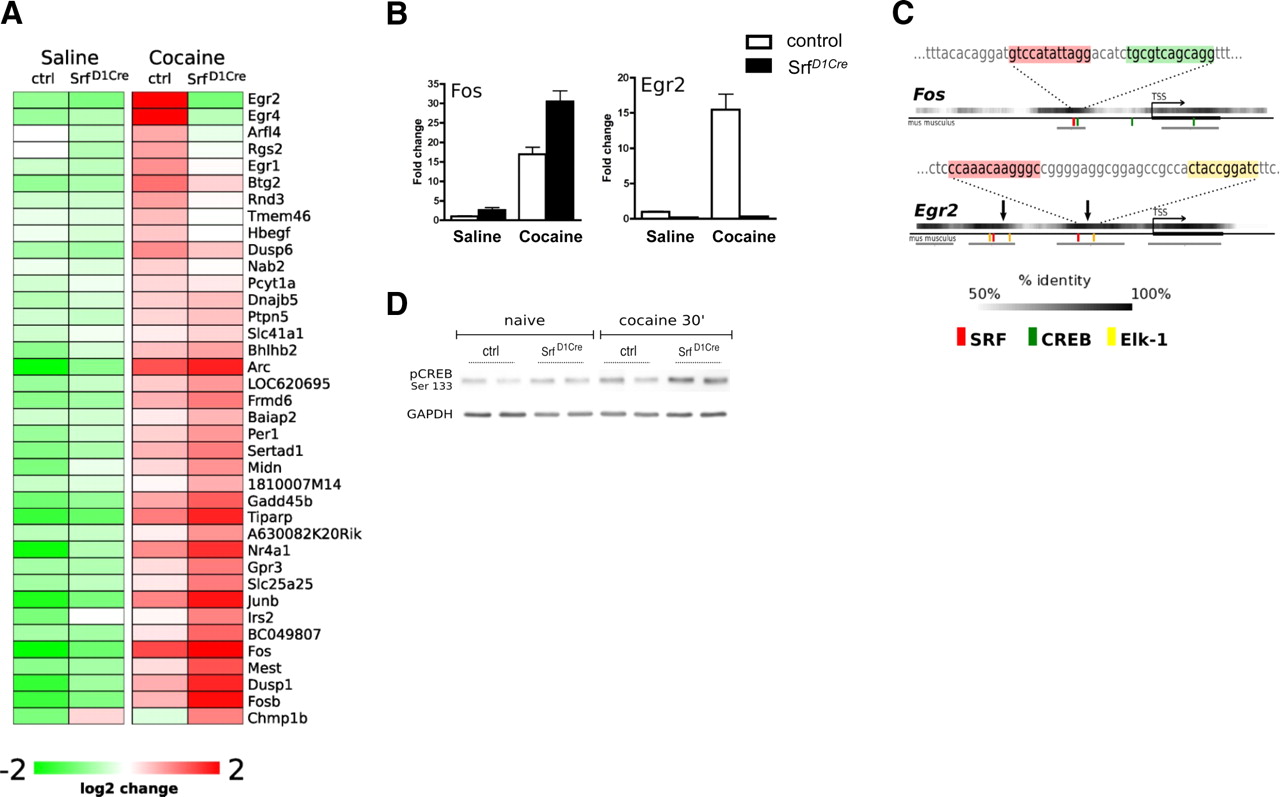
Heatmap presenting genes which induction is affected by Srf knock-out (Rodriguez-Parkitna et al., (2010)
1.3. List of genes
Here is the list of genes selected from the article. These genes are suspected to be regulated by SRF transcription factor.
Egr1
Egr2
Egr4
Arl4d
Rgs2
1.4. Submit the list of genes
You can copy/paste the above list of genes into the input area and press “submit” or just use the link: submit query
1.5. Inspect results
To inspect results press the “statistics” button. A table with results will be shown below input field. The most over-represented track is “SRF_02”. The average coverage in selected gene promoters is 0.74, while in the reference it is 0.078. This is 9.5 time more in query set then genome average. T test p value is 8.8E-63. Therefore, the result is very significant (even after Bonferroni correction, 1.9E-60). This means that SRF is highly over-represented in your query set. Therefore, this transcription factor might be key controlling factor of this list of genes. This is in agreement with expectations.
You can press “description” button in the first result line. You will see GEO submission number (GSM530190). You can get more information about this track there. Some other basic informations are also included (e.g. cell type).
If you press “stack plot” button, you will see distribution of coverages in reference and your query set.
It is also possible too see coverages for particular genes, by pressing the “show genes” button.